
The storm already told you where your next 100 leads are.
Storm Intel pulls real, live National Weather Service and NOAA data, every warning polygon, every hail size, every wind gust, and turns it into a street-level map of exactly which homes just got hit. No waiting for adjusters. No guessing which neighborhoods to canvass. The storm data is the lead list.
Storm damage is the best lead in roofing, if you get there first.
Most teams find out where storms hit the same way everyone else does: word of mouth, a news alert, or a competitor's truck already parked on the street. By the time you canvass, the easy doors are already knocked.
Storm Intel is a live command map built directly on government weather data, the same NWS warning boundaries meteorologists issue in real time, cross-referenced with years of historical hail, wind, and flood reports. Drop a pin, get an address-level storm history.
Real government data, on a live map.
Every clip is a real capture built on live NWS/NOAA/IEM feeds. Switch chapters and hover the pins to see what each beat surfaces.
Reveal a warning zone.
Pick a storm type, reveal the NWS-style corridor, and watch the estimated homes-affected count resolve. Click a pin for an address's five-year storm history.
Illustrative demo. In the product, every polygon is a real, live NWS boundary, numbers change with each storm.
From a county map to a knocked door.
 click to zoom
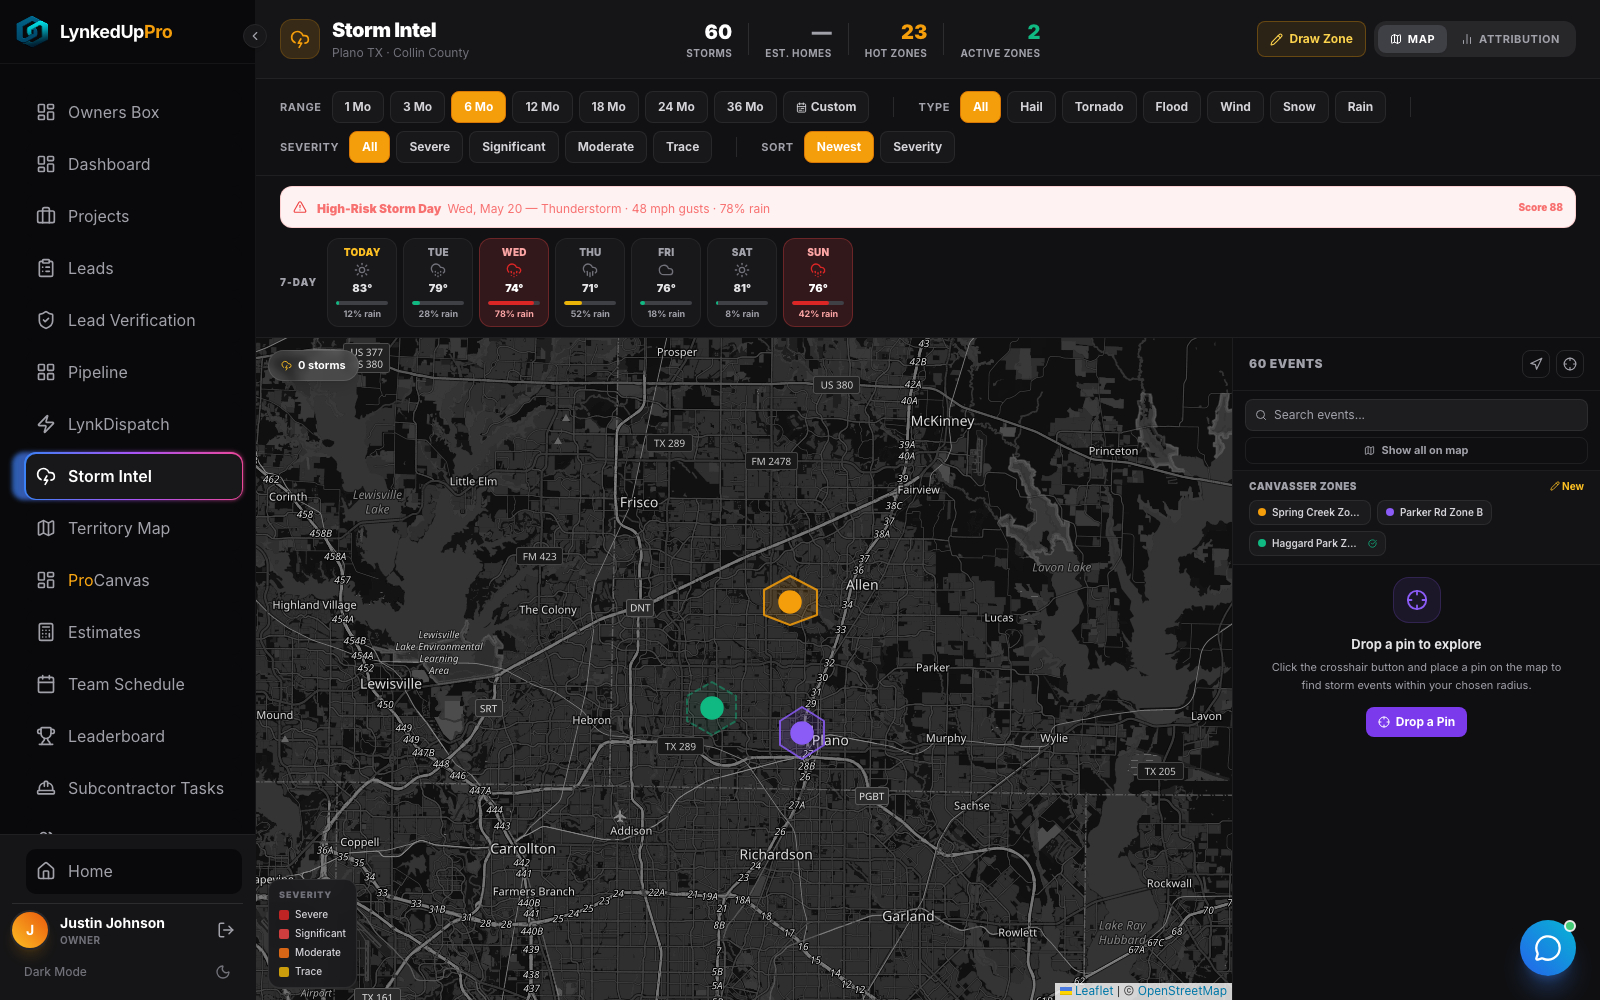
Your whole territory, scored for storm risk.
Hot zones, active canvasser zones, and a 7-day forecast strip with a storm-risk score per day, live from the National Weather Service before you click anything.
 click to zoom
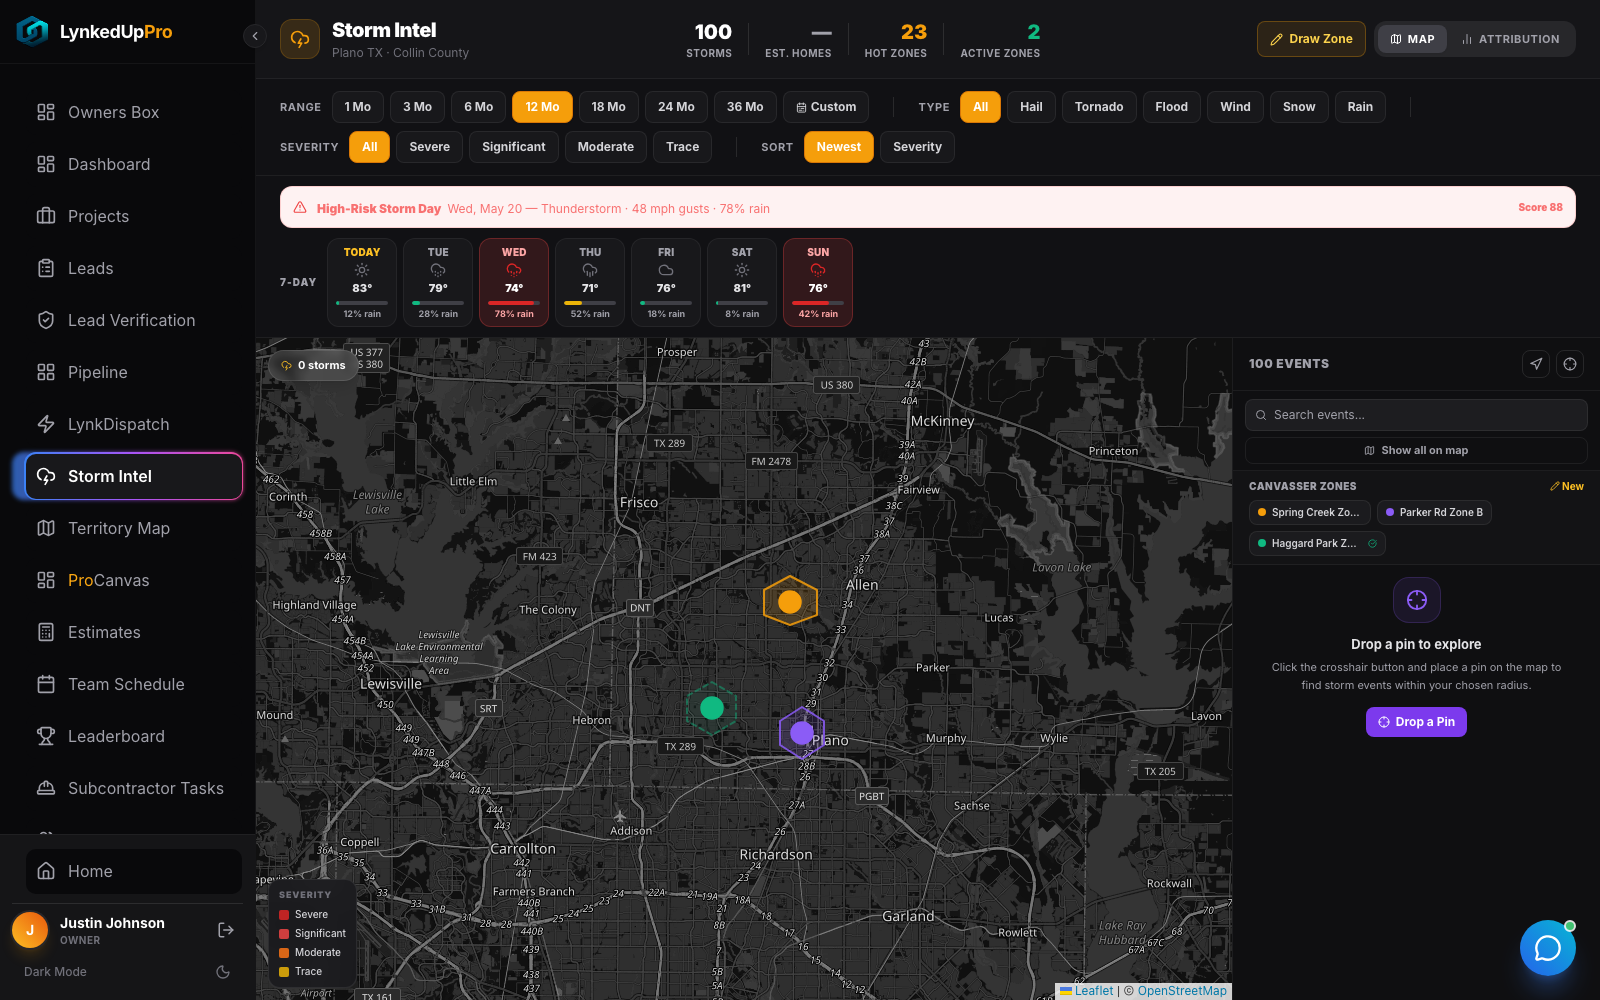
Widen the lens, real events, real dates.
Pulling a 12-month range routinely surfaces dozens of real, dated NWS-issued events for a single county.
 click to zoom
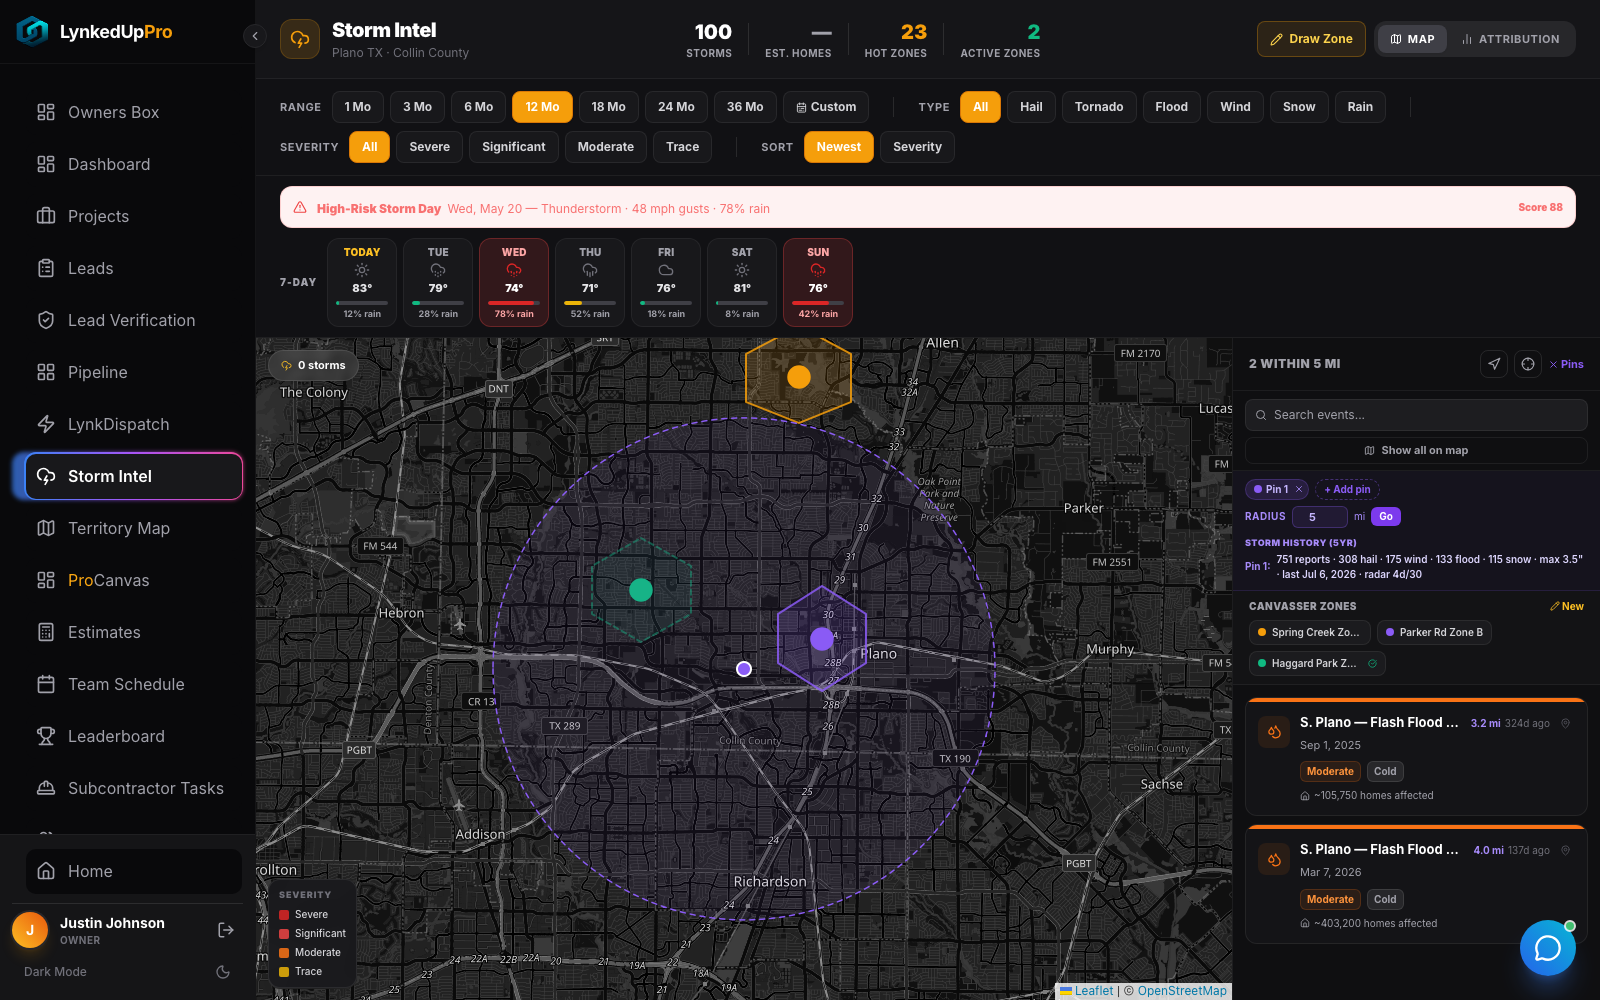
Drop a pin, get a property's history.
Queries real government storm archives (IEM Local Storm Reports fused with NOAA radar-derived hail data): report count, storm types, max hail size, and how recently it was hit.
 click to zoom
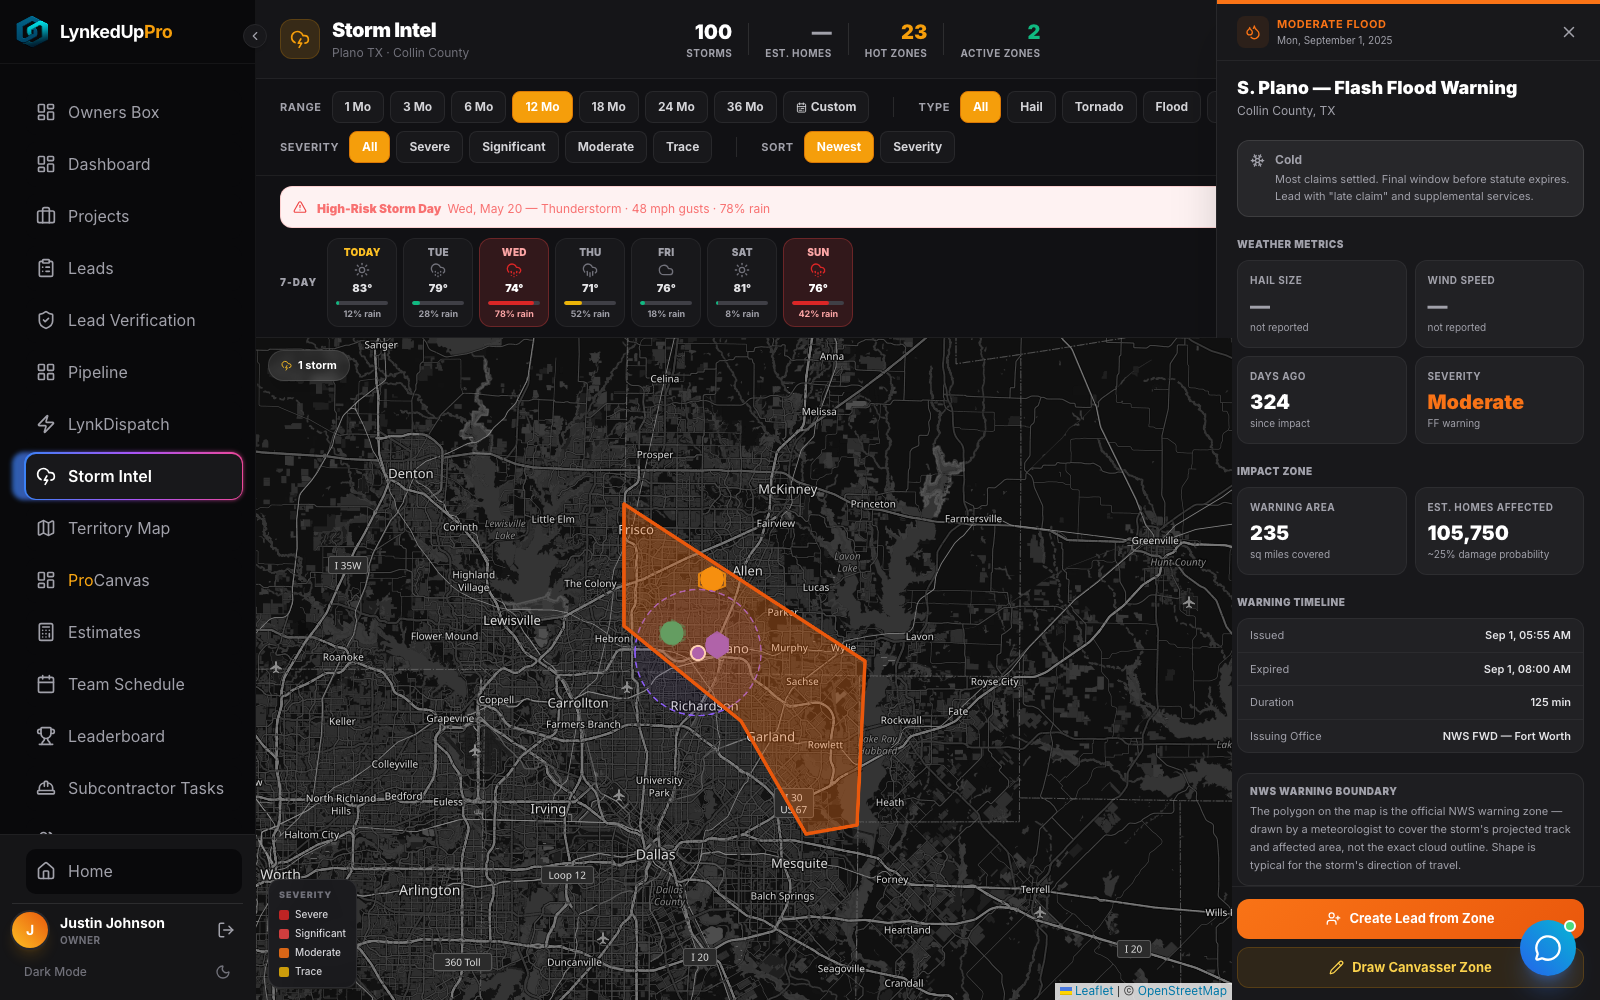
See the real zone and the sales angle.
The actual NWS-issued warning polygon draws. The detail drawer shows hail size in plain damage language, estimated homes affected, a built-in conversion-window script, and one-click “Create Lead” or “Open in LynkDispatch.”
Every zone comes with a timing-aware talk track.
Storm Intel reads how fresh the claim window is and hands your rep the right script.
| Window | What the rep leads with |
|---|---|
| Hot Zone | Peak canvassing window. Claims actively being filed, homeowners are receptive. Lead with a free inspection. |
| Warm | Claims in process. Lead with supplement expertise and contractor credentials. |
| Cold | Most claims settled. Final window before the statute expires, lead with "late claim." |
| Too Fresh | Adjuster process hasn't started. Build rapport, follow up in 2–3 weeks. |
Real data, not vibes.
Know a storm hit before the neighborhood chatter does.
Real warning polygons show the exact affected footprint, not a rough radius.
Every zone comes with a timing-aware talk track.
Each figure ties back to an actual NWS warning or NOAA radar report.
Attribution by zone proves which storms were worth the gas money.
Storm intelligence hands off to LynkDispatch automatically, not a data silo.
The questions every operator asks.
No, it uses the specific NWS-issued polygon, cross-references years of ground-truth reports, estimates the homes inside, and hands your rep a timing-aware sales script.
It's built with graceful fallback chains across NWS alerts, the IEM historical archive, and NOAA radar, it never just shows a blank map.
No, homes-affected, severity tier, and sales-script staging are computed automatically.
From a storm detail drawer, "Open in LynkDispatch" hands the zone straight to your dispatcher, and a confirmed storm flips Storm Mode automatically.
The other seven moving parts.
The National Weather Service already mapped your next route.
Storm Intel just puts it in your hand. Book a walkthrough and we'll pull live storm history on your own territory.