
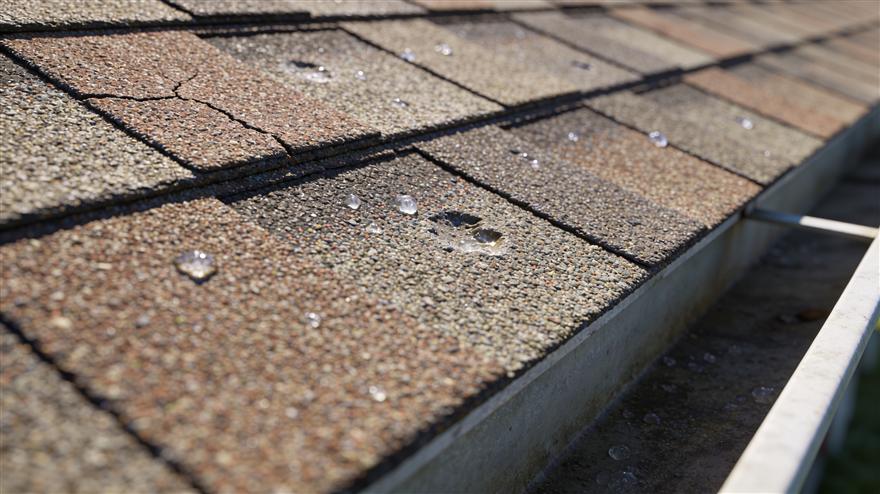
Every roofing company has a feeling about where hail hits hardest. We wanted numbers instead. We pulled every hail report in NOAA's Storm Events Database for 2023, 2024, and 2025 and counted them by state, by county, by size, and by month. This is what the 2025 data says, and what a roofing company can actually do with it.
One caveat before the tables, because it matters: these are storm reports, not damage claims. A report is logged when a trained spotter, a member of the public, or the National Weather Service records hail at a place and time. Busy metro areas generate more reports than empty ranchland hit by the same storm. Treat the numbers as a strong signal of where hail is observed, not a direct count of damaged roofs.
The Headline Numbers for 2025
- 9,205 hail reports across the United States in 2025, up 3% from 8,941 in 2024 and down 22% from 11,761 in 2023.
- 7,865 reports (85%) were 1 inch or larger, the size where insurers commonly start finding functional damage on asphalt shingles.
- 1,046 reports (11%) were 2 inches or larger.
- Texas logged 1,453 reports, 16% of the national total and more than the next two states combined.
- 77% of all reports fell between March and June, and May alone accounted for 31%.
- The largest reported stone was 6.0 inches, in Dickens County, Texas, on 25 May 2025.
Top 10 States by Hail Reports in 2025
| Rank | State | All hail reports | 1 inch or larger | 2 inches or larger |
|---|---|---|---|---|
| 1 | Texas | 1,453 | 1,302 | 248 |
| 2 | Oklahoma | 836 | 637 | 91 |
| 3 | Kansas | 541 | 488 | 77 |
| 4 | Missouri | 493 | 478 | 56 |
| 5 | Colorado | 492 | 418 | 82 |
| 6 | Nebraska | 441 | 411 | 76 |
| 7 | Tennessee | 382 | 338 | 32 |
| 8 | Wisconsin | 359 | 299 | 40 |
| 9 | Illinois | 331 | 301 | 40 |
| 10 | South Dakota | 329 | 267 | 28 |
Texas is in a league of its own on large hail: 248 reports of 2 inches or more, which is 24% of every 2-inch report in the country. Oklahoma, the clear number two on total reports, had 91.
Top 15 Counties by Hail Reports in 2025
State totals hide where the work actually is. At county level, metro areas with heavy spotter coverage rise to the top, which is exactly where most roofing customers live.
| Rank | County | State | Hail reports |
|---|---|---|---|
| 1 | St. Louis | Missouri | 93 |
| 2 | El Paso | Colorado | 92 |
| 3 | Oklahoma | Oklahoma | 87 |
| 4 | Tulsa | Oklahoma | 82 |
| 5 | Williamson | Texas | 73 |
| 6 | Cleveland | Oklahoma | 71 |
| 7 (tie) | Weld | Colorado | 66 |
| 7 (tie) | Tarrant | Texas | 66 |
| 9 | Dane | Wisconsin | 59 |
| 10 | Lincoln | Colorado | 55 |
| 11 | Laramie | Wyoming | 44 |
| 12 (tie) | Williamson | Tennessee | 43 |
| 12 (tie) | Allegheny | Pennsylvania | 43 |
| 14 | Sedgwick | Kansas | 40 |
| 15 | Elbert | Colorado | 37 |
Three of the top six counties are in Oklahoma, and the Oklahoma City metro (Oklahoma and Cleveland counties) alone logged 158 reports. Colorado's Front Range shows up four times: El Paso (Colorado Springs), Weld, Lincoln, and Elbert.
Where the Big Stones Fell: 2-Inch Hail Leaders
Report counts tell you where hail is frequent. Large hail tells you where replacements, not repairs, are likely. These are the counties with the most reports of hail 2 inches or larger in 2025.
| County | State | Reports of 2"+ hail |
|---|---|---|
| Lincoln | Colorado | 23 |
| Williamson | Tennessee | 11 |
| St. Charles | Missouri | 10 |
| Parker | Texas | 10 |
| Pecos | Texas | 10 |
| Las Animas | Colorado | 10 |
| Tarrant | Texas | 10 |
| Elbert | Colorado | 9 |
| Gillespie | Texas | 9 |
| Williamson | Texas | 9 |
Williamson County, Tennessee (south of Nashville) stands out. Tennessee more than doubled its hail reports from 169 in 2024 to 382 in 2025, and its suburban counties saw stones big enough to total roofs.
When Hail Hits: The 2025 Monthly Pattern
| Month | All reports | 1 inch or larger | Share of the year |
|---|---|---|---|
| March | 1,084 | 911 | 12% |
| April | 1,820 | 1,524 | 20% |
| May | 2,835 | 2,449 | 31% |
| June | 1,384 | 1,203 | 15% |
| July | 768 | 664 | 8% |
| August | 494 | 429 | 5% |
| September | 544 | 464 | 6% |
| October to February | 276 | 221 | 3% |
March through June produced 7,123 of the year's 9,205 reports. If your canvassing team, adjusters, and production crews are not fully staffed by early April, you are hiring into the busiest month of the year.
Dallas–Fort Worth: A Closer Look
DFW is one of the most competitive storm markets in the country, so we pulled its four core counties separately across all three years.
| County | 2023 reports | 2024 reports | 2025 reports | 2025 reports 1"+ | Largest 2025 report |
|---|---|---|---|---|---|
| Tarrant | 58 | 106 | 66 | 64 | 3.0 in |
| Collin | 35 | 34 | 33 | 29 | 2.25 in |
| Denton | 59 | 85 | 24 | 19 | 1.5 in |
| Dallas | 51 | 28 | 16 | 15 | 2.0 in |
| Four-county total | 203 | 253 | 139 | 127 |
Two things jump out. First, 2025 was a quieter year in the core of DFW: 139 reports against 253 in 2024, a 45% drop. Second, the activity shifted west. Tarrant County kept 66 reports and 10 of them were 2 inches or larger, and neighboring Parker County also logged 10 reports of 2-inch hail. Denton County, which had 85 reports in 2024, fell to 24, and its largest stone in 2025 was 1.5 inches.
For a DFW roofer, that means the 2024 storm footprint in Denton is now an aging-claim market, while western Tarrant and Parker are where fresh 2025 damage sits. Our Dallas–Fort Worth hail season playbook covers how local crews work both.
Year Over Year: Which States Are Heating Up
| State | 2023 | 2024 | 2025 | Change 2024 to 2025 |
|---|---|---|---|---|
| Texas | 1,912 | 1,588 | 1,453 | -9% |
| Oklahoma | 742 | 765 | 836 | +9% |
| Kansas | 780 | 767 | 541 | -29% |
| Missouri | 550 | 496 | 493 | -1% |
| Colorado | 769 | 415 | 492 | +19% |
| Nebraska | 744 | 510 | 441 | -14% |
| Tennessee | 148 | 169 | 382 | +126% |
| Wisconsin | 273 | 225 | 359 | +60% |
| Illinois | 580 | 373 | 331 | -11% |
| South Dakota | 467 | 317 | 329 | +4% |
Among states with at least 100 reports in 2025, the biggest rises from 2024 were Kentucky (103 to 262, +154%), Alabama (81 to 184, +127%), Tennessee (169 to 382, +126%), West Virginia (49 to 104, +112%), and Montana (96 to 190, +98%). The biggest falls were Iowa (417 to 256, -39%), Pennsylvania (209 to 132, -37%), and Kansas (767 to 541, -29%).
Single-year swings are noisy, so do not move your company on one year of data. But a Mid-South roofer who assumed hail was a Plains problem now has two years of evidence that it is not.
What Roofers Should Do With This Data
1. Plan territories by county, not by state
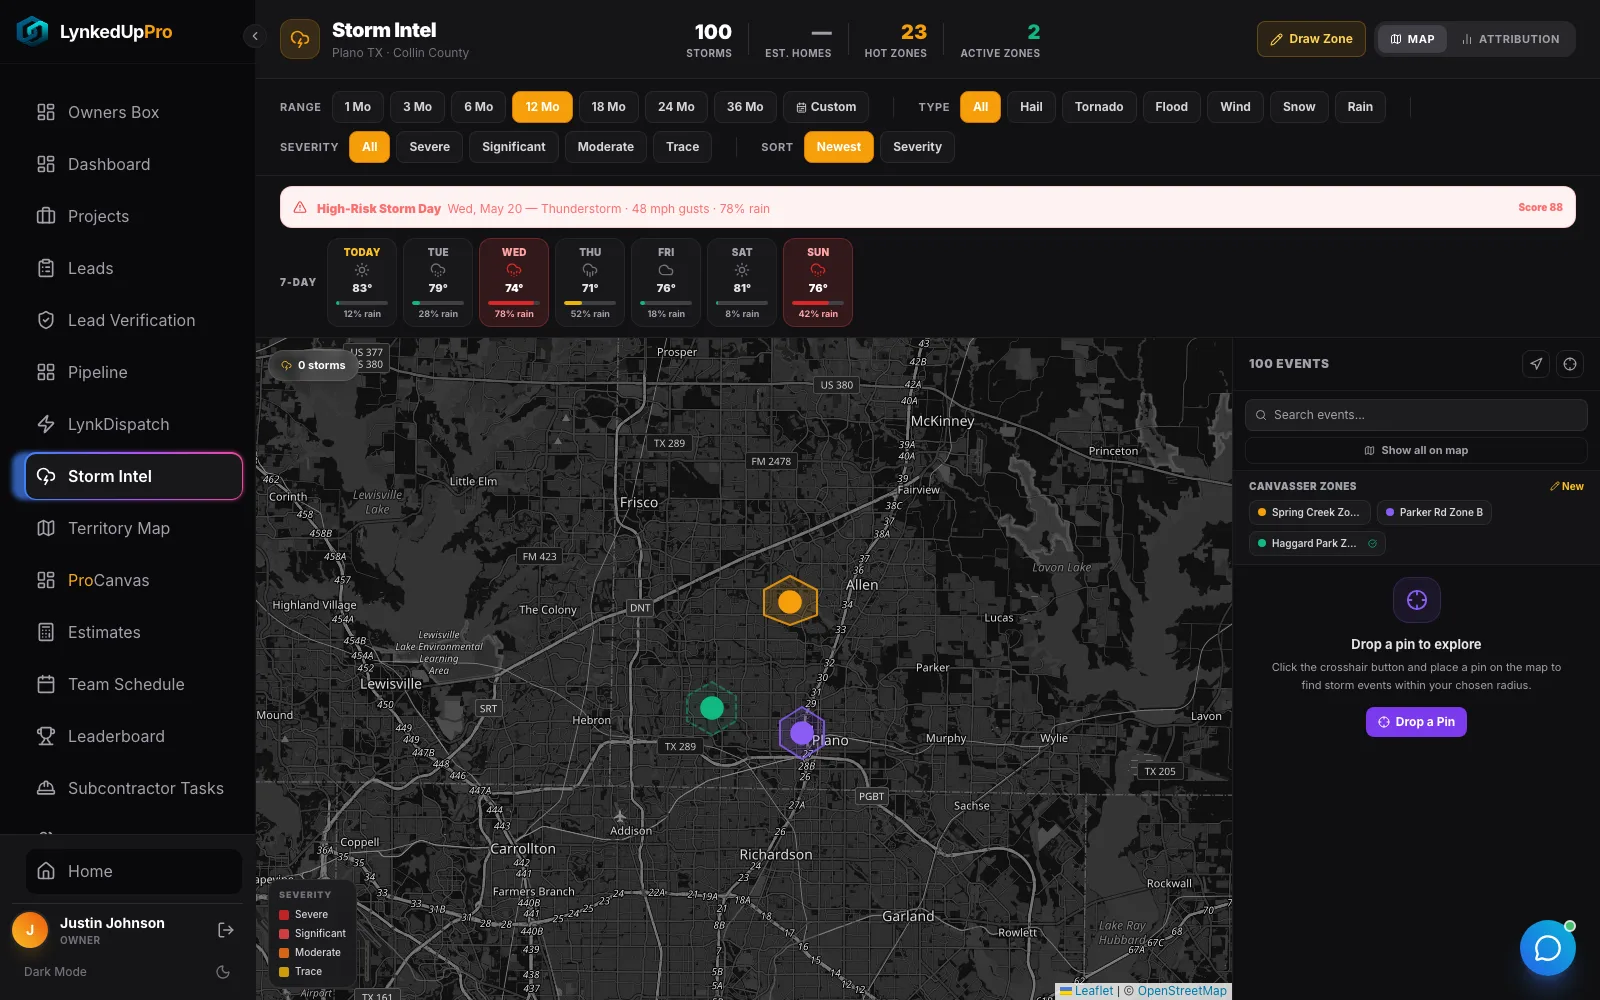
The difference between Tarrant and Dallas counties in 2025 (66 reports versus 16) is bigger than the difference between many states. Build canvassing territories around the counties and ZIP codes where reports cluster, then refine them with storm-by-storm swaths. Storm Intel does this inside LynkedUp Pro, mapping each event so a manager can turn an impact zone into a canvassing territory.
2. Staff for April and May, not for "storm season"
Half of 2025's reports landed in April and May. Recruit and train canvassers in February and March, line up subcontractor crews before April, and expect production to back up into June and July. The quiet months from October to February (3% of reports) are the time to work aged claims, referrals, and retail replacements.
3. Prioritise neighbourhoods with 1-inch-plus reports
85% of reports were 1 inch or larger, but the 11% at 2 inches or more are where full replacements cluster. When two storms land the same week, send your first door-knockers to the larger hail. Our guide to reading hail maps explains how to tell a real swath from a scattered report.
4. Time the knock
Homeowners are most receptive in the days right after a storm, while the damage is fresh and before every other roofer has knocked. Route reps with roofing canvassing software so they work the impact zone street by street, log every door, and push interested homeowners straight into the CRM. The storm restoration lead generation playbook covers the full sequence.
5. Watch the year-over-year shifts
If you operate in Tennessee, Kentucky, Alabama, or Wisconsin, 2025 made the case for real storm tooling. Expanding crews into a neighbouring state is expensive. Checking the next spring's reports against these numbers is cheap. Storm intelligence software keeps that history on hand for your own service area, so the decision rests on data rather than memory.
Methodology and Source
All figures come from the NOAA National Centers for Environmental Information Storm Events Database. We downloaded the event detail files on 23 October 2026:
- StormEvents_details-ftp_v1.0_d2023_c20260323.csv.gz
- StormEvents_details-ftp_v1.0_d2024_c20260728.csv.gz
- StormEvents_details-ftp_v1.0_d2025_c20260819.csv.gz
We kept rows where EVENT_TYPE is "Hail". State counts use the STATE field. County counts use CZ_NAME where CZ_TYPE is "C" (county), so county names are as NOAA records them. Size thresholds use the MAGNITUDE field, which for hail is the reported stone diameter in inches. Every count was run twice by two independent methods and matched exactly.
Limits worth knowing:
- Reports, not damage. A report is an observation. Population density, spotter networks, and weather service coverage all affect how many reports an area produces.
- One storm, many reports. A single storm can produce dozens of reports along its path, so counts measure observed activity, not the number of separate storms.
- NOAA revises data. NOAA updates these files over time. The 2025 file was created on 19 August 2026, and later versions may differ slightly.
Frequently Asked Questions
Which state had the most hail in 2025?
Texas, with 1,453 hail reports in NOAA's Storm Events Database, followed by Oklahoma (836) and Kansas (541). Texas also led on large hail, with 248 reports of stones 2 inches or larger.
Which county had the most hail reports in 2025?
St. Louis County, Missouri (93 reports), narrowly ahead of El Paso County, Colorado (92), and Oklahoma County, Oklahoma (87). Lincoln County, Colorado had the most reports of 2-inch-plus hail, with 23.
What month has the most hail?
May. In 2025 it accounted for 2,835 of 9,205 reports, or 31%. March through June together produced 77% of all reports.
What size hail damages a roof?
Hail around 1 inch and larger is commonly where functional damage to asphalt shingles starts showing up, depending on roof age, material, and wind. In 2025, 85% of US hail reports were 1 inch or larger. An inspection is the only way to know whether a specific roof was damaged.
Are hail reports the same as hail damage?
No. Reports are observations logged by spotters, the public, and the National Weather Service. More people means more reports, so cities often show more reports than rural areas hit by the same storm. Use reports to find where to look, then confirm damage on the roof.